Calculate Density of Multiple dPCR runs
Calculates the density of the number of positive molecules or the average number
of molecules per partition of dpcr objects.
dpcr_density_table(input, average = FALSE, methods = "wilson",
  conf.level = 0.95)
Arguments
- input
- an object of class
dpcr. - average
- If
TRUE, calculates density of the average number of molecules per partition. IfFALSE, instead performs calculations for the total number of positive molecules. - methods
- Method for calculating the confidence interval.
Possible values are:
"wilson","agresti-coull","exact","prop.test","profile","lrt","asymptotic","bayes","cloglog","logit","probit". Default value is"wilson". See Details. - conf.level
- The level of confidence to be used in the confidence interval. Values from 0 to 1 and -1 to 0 are acceptable.
Value
A list (with the length equal to the number of runs in input) of
data frames containing densities and borders of confidence intervals.
See also
dpcr_density for easy analysis and plots of single runs.
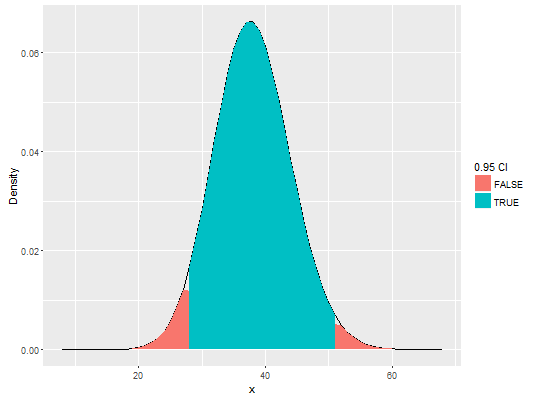
Examples
dens <- dpcr_density_table(six_panels)

# create plot using ggplot2
library(ggplot2)

ggplot(dens[["Experiment2.2"]], aes(x = x, y = y)) +
  geom_line() +
  geom_area(aes(fill = !(conf_up | conf_low))) +
  scale_y_continuous("Density") +
  scale_fill_discrete("0.95 CI")