Class
A class containing results of any digital PCR experiment.
Type of data in all columns is specified in slot "type".
Details
Possible type values of dpcr objects:
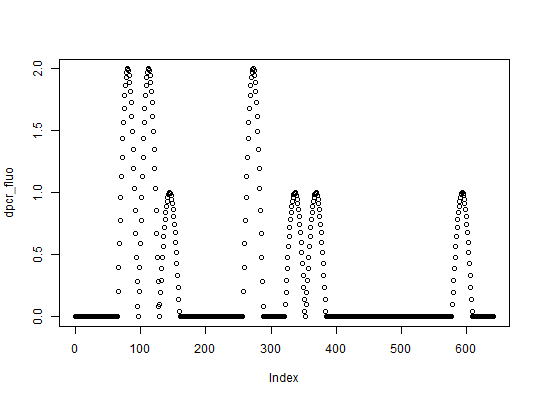
"ct": cycle threshold of each partition,"fluo": fluorescence of each partition,"nm": number of molecules in each partition,"np": status (positive (1) or negative(0)) of each partition,"tnp": total number of positive partitions in the run (single value per each run, not per partition).
Digital PCR data is always a matrix, where columns and rows represent
respectively runs and data points. For example, matrix with 2 columns and 765 rows
means two runs with 765 data points each. In case of "tnp" data, each run is
represented by only one measurement, the count of all positive partitions.
The number of partitions is defined in slot n. In the previous example,
two runs have 765 data points, but they can have less detected partitions
(for example some reads may be not available). In this case, the data point will
have value NA.
The structure of dpcr class is described more deeply in the vignette.
Slots
.Datamatrixdata from digital PCR experiments. See Details.nintegerequal to the number of partitions in each run.experfactorthe id or name of experiments.replicatefactorthe id or name of replicates.assayfactorthe id or name of the assay.v"numeric"volume of the partition [nL].uv"numeric"uncertainty of the volume of the partition [nL].threshold"numeric"value specifying the threshold. Partition with the value equal or bigger than threshold are considered positive.type- Object of class
"character"defining type of data. See Details.
Note
This class represent the most general droplet-based digital PCR. In more specific
cases, the user is directed to other classes: adpcr, where
results can be placed over a plate, qdpcr where digital
assay is based on multiple qPCR experiments and rtadpcr,
where data points represent the status of partitions measured in the
real time.
