Calculate Density of Single dPCR Run
Calculates and plots the density of the number of positive molecules or the average number of molecules per partition. Can be used for both array digital PCR and droplet digital PCR.
dpcr_density(k, n, average = FALSE, methods = "wilson", conf.level = 0.95,
  plot = TRUE, bars = FALSE, ...)
Arguments
- k
- Total number of positive molecules.
- n
- Total number of partitions.
- average
- If
TRUE, calculates density of the average number of molecules per partition. IfFALSE, instead performs calculations for the total number of positive molecules. - methods
- Method for calculating the confidence interval.
Possible values are:
"wilson","agresti-coull","exact","prop.test","profile","lrt","asymptotic","bayes","cloglog","logit","probit". Default value is"wilson". See Details. - conf.level
- The level of confidence to be used in the confidence interval. Values from 0 to 1 and -1 to 0 are acceptable.
- plot
- If
TRUE, plots density plot. - bars
- plot on density plot bars for discrete values of lambda.
- ...
- Additional arguments send to
plotfunction.
Value
A data frame with one row containing bounds of the confidence intervals and a name of the method used to calculate them.
References
Brown, Lawrence D., T. Tony Cai, and Anirban DasGupta. Confidence Intervals for a Binomial Proportion and Asymptotic Expansions. The Annals of Statistics 30, no. 1 (February 2002): 160--201.
See also
Computation of confidence intervals: binom.confint,
The browser-based graphical user interface for this function: dpcr_density_gui.
Examples
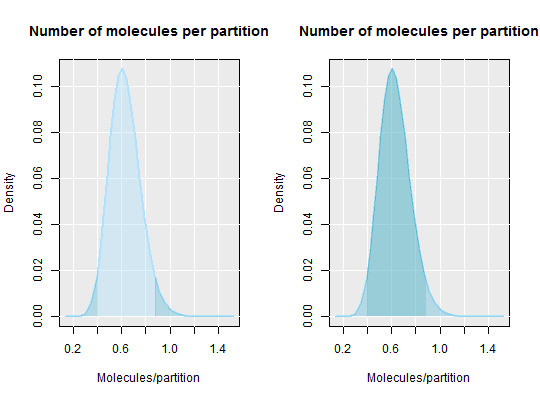
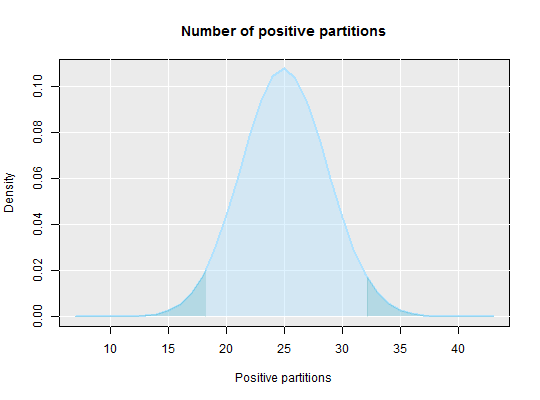
# Calculate the average number of molecules per partition and show the area
# of the confidence interval (left plot) and the area within the
# confidence interval
par(mfrow = c(1,2))
dpcr_density(k = 25, n = 55, average = TRUE, methods = "wilson",
             conf.level = 0.95)#>   method  k  n    lambda    lower     upper
#> 1 wilson 25 55 0.6061358 0.400855 0.8789302dpcr_density(k = 25, n = 55, average = TRUE, methods = "wilson",
             conf.level = -0.95)#>   method  k  n    lambda     lower    upper
#> 1 wilson 25 55 0.6061358 0.8789302 0.400855par(mfrow = c(1,1))

# By setting average to FALSE the total number of positive molecules is
# calculated
dpcr_density(k = 25, n = 55, average = FALSE, methods = "wilson",
             conf.level = 0.95)#>   method  k  n mean   lower    upper
#> 1 wilson 25 55   25 18.1639 32.16252