Plot and Compare Densities
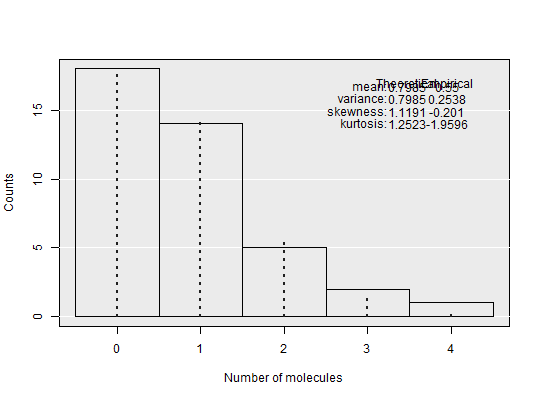
Plot empirical and theoretical density of the result of the digital PCR experiment.
compare_dens(input, moments = TRUE, ...)
Arguments
- input
- object of class
dpcrcontaining only one run. - moments
- logical, if
TRUE, both theoretical and empirical moments are printed on the plot. - …
- other arguments passed to the
plotfunction.
See also
moments is used to calculate moments of Poisson distribution.
Examples
adpcr_big <- sim_adpcr(m = 35, n = 40, times = 50, pos_sums = FALSE, n_panels = 1)
compare_dens(adpcr_big, moments = TRUE)