Peak Test
Detect, separate and count positive and negative peaks, as well as peak-like noise. Additionally, function calculates area of the peaks.
Arguments
- x
- a vector containing the abscissa values (e.g., time, position) OR
an object of class
adpcr. - y
- a vector of fluorescence value.
- threshold
- a value, which defines the peak heights not to consider as peak.
- noise_cut
- a numeric value between 0 and 1. All data between 0 and
noise_cutquantile would be considered noise in the further analysis. - savgol
- logical value. If
TRUE, Savitzky-Golay smoothing filter is used. - norm
- logical value. If
TRUE, data is normalised. - filter.q
- a vector of two numeric values. The first element represents the quantile of the noise and the second one is the quantile of the negative peaks.
Value
A list of length 2. The first element is a data frame containing: peak number, peak group (noise, negative, positive), position of the peak maximum, area under the peak, peak width, peak height, position of the peak and time resolution.
The second element contains smoothed data.
Details
The localization of peaks is determined by the
findpeaks function. The area under the peak is
calculated by integration of approximating spline.
References
Savitzky, A., Golay, M.J.E., 1964. Smoothing and Differentiation of Data by Simplified Least Squares Procedures. Anal. Chem. 36, 1627-1639.
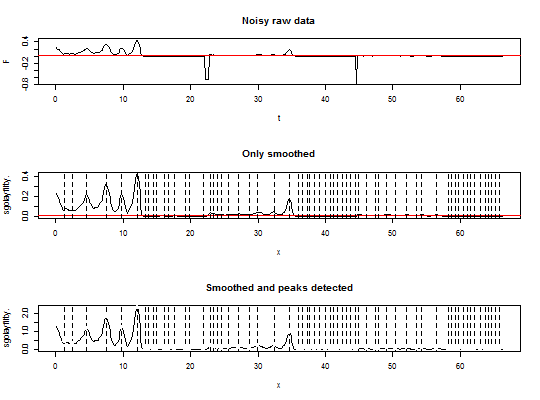
Examples
data(many_peaks) par(mfrow = c(3,1)) plot(many_peaks, type = "l", main = "Noisy raw data") abline(h = 0.01, col = "red") tmp.out <- test_peaks(many_peaks[, 1], many_peaks[, 2], threshold = 0.01, noise_cut = 0.1, savgol = TRUE) plot(tmp.out[["data"]], type = "l", main = "Only smoothed") abline(h = 0.01, col = "red") abline(v = many_peaks[tmp.out[["peaks"]][, 3], 1], lty = "dashed") tmp.out <- test_peaks(many_peaks[, 1], many_peaks[, 2], threshold = 0.01, noise_cut = 0.1, savgol = TRUE, norm = TRUE) plot(tmp.out[["data"]], type = "l", main = "Smoothed and peaks detected")abline(v = many_peaks[tmp.out[["peaks"]][, 3], 1], lty = "dashed")for(i in 1:nrow(tmp.out$peaks)) { if(tmp.out$peaks[i, 2] == 1) {col = 1} if(tmp.out$peaks[i, 2] == 2) {col = 2} if(tmp.out$peaks[i, 2] == 3) {col = 3} points(tmp.out$peaks[i, 7], tmp.out$peaks[i, 6], col = col, pch = 19) }positive <- sum(tmp.out$peaks[, 2] == 3) negative <- sum(tmp.out$peaks[, 2] == 2) total <- positive + negative