Plot
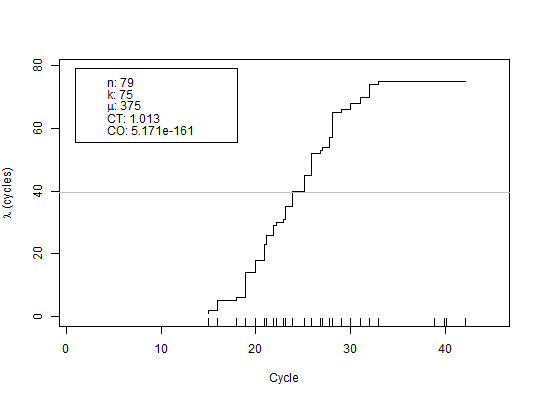
An analytical plot describing relationship between the cycle number and the current value of Poisson mean. The plot can be used for quality control of process.
Arguments
- x
- is a
qdpcrobject. - mincyc
- is the first cycle to start the plot from.
- maxcyc
- the last cycle for the plot.
- rug
- Adds a rug representation of the data to the plot.
- digits
- how many significant digits are to be used in plot.
Details
The rug parameter allows user to add density of the number of events
to the plot.
See also
Examples
library(qpcR)
test <- cbind(reps[1L:45, ], reps2[1L:45, 2L:ncol(reps2)], reps3[1L:45,
        2L:ncol(reps3)])

plot(qpcr2pp(data = test, cyc = 1, fluo = NULL, model = l5, delta = 5), rug = TRUE)