A function to analyze plot the raw data from a BioRad droplet digital PCR
bioamp is a function to plot and analyze the amplitude data of a
BioRad droplet digital PCR experiment.
bioamp(data = data, amp_x = 1, amp_y = 2, cluster = 3, robust = TRUE,
  plot = TRUE, stat = TRUE, xlab = "Assay 1 Amplitude",
  ylab = "Assay 2 Amplitude", ...)
Arguments
- data
- object of class
whatcontaining the amplitude data. - amp_x
- is the first amplitude channel (x-axis).
- amp_y
- is the second amplitude channel (y-axis).
- cluster
- are the clusters of the plot. The number indicates the column of a table, which contains the cluster information.
- robust
- Is the method used to calculate the location (mean or median) and dispersion (standard deviation or median absolute deviation).
- plot
- logical, if
TRUE, the plot is printed. - stat
- logical, if
TRUE, the statistics of the droplet digital PCR experiment are calculated. - xlab
- x-label of the plot.
- ylab
- y-label of the plot.
- …
- other arguments passed to the
plotfunction (seeplot.defaultfor details).
Examples
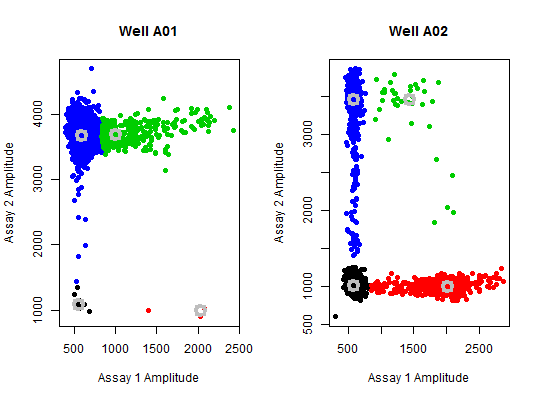
par(mfrow = c(1,2))
bioamp(data = pds_raw[["A01"]], main = "Well A01", pch = 19)#>                   Cluster.1  Cluster.2 Cluster.3   Cluster.4
#> Counts Ch. 1       11.00000    3.00000  398.0000 11552.00000
#> Counts Ch. 2       11.00000    3.00000  398.0000 11552.00000
#> Location Ch. 1    553.69556 2026.70093  995.2142   590.94425
#> Location Ch. 2   1084.54590  995.84230 3694.3724  3676.18494
#> Dispersion Ch. 1   24.43643   80.47304  182.0612    51.25585
#> Dispersion Ch. 2   84.69588   32.88620  136.8308   115.59810bioamp(data = pds_raw[["A02"]], main = "Well A02", pch = 19)#>                   Cluster.1  Cluster.2 Cluster.3  Cluster.4
#> Counts Ch. 1     9781.00000  792.00000   38.0000  587.00000
#> Counts Ch. 2     9781.00000  792.00000   38.0000  587.00000
#> Location Ch. 1    579.75195 2016.80012 1427.3433  586.43384
#> Location Ch. 2   1015.20868  999.26620 3468.6197 3465.11963
#> Dispersion Ch. 1   40.21337  177.15604  352.1041   46.17048
#> Dispersion Ch. 2   50.94112   58.83233  183.7515  159.30630par(mfrow = c(1,1))